VR
Hello, I'm
Vijayalakshmi R
Data Analyst
In numbers
0
Projects
0
Dashboards
0
Datasets
0
KPI Reports
Skilled in
🐍 Python
🗄️ SQL
📋 Excel
📊 Tableau / Power BI
Portfolio ready
Let's Explore →
Open to Opportunities

Vijayalakshmi R

Data Analyst

I build |

Turning raw data into SQL queries, clean spreadsheets, and interactive Tableau and Power BI dashboards that turn numbers into decisions that matter.

0
Projects
0
Datasets
0
Dashboards
0
KPI Reports
🧑‍💻
0
Projects Done
0
Datasets Cleaned
0
KPI Reports Delivered
0
Interactive Dashboards

Data-Driven Analyst

I'm a Data Analyst who turns raw, messy data into clear business insight. I work end-to-end — pulling and shaping data with SQL and Python, cleaning and modeling it in Excel, and presenting it through interactive dashboards that stakeholders can actually act on.

My day-to-day toolkit centers on SQL for querying and analysis, Python (Pandas/NumPy) for data cleaning and exploration, Excel for modeling and reporting, and Tableau or Power BI for building the dashboards that surface trends, KPIs, and root causes.

I care about the full analytics workflow — from understanding a business question, to writing the query, to designing a dashboard that answers it clearly and drives a decision.

PythonSQLTableau Power BIExcelPandas Data CleaningData VisualizationKPI Reporting Statistical AnalysisDashboard Design

Technical Arsenal

The core toolkit I use every day to query, clean, analyze, and visualize data.

🗄️
Query & Databases
SQL (MySQL / SQL Server)Advanced
Advanced SQL (CTEs, Windows)Proficient
Data Cleaning & WranglingAdvanced
📊
BI & Visualization
TableauProficient
Power BIProficient
Dashboard Design & KPI ReportingProficient
📋
Spreadsheets, Python & Stats
Excel (Power Query, Pivot Tables)Advanced
Python (Pandas / NumPy)Proficient
Statistics & EDAGrowing

Featured Work

End-to-end data analytics projects with interactive dashboards built in SQL, Python, Excel, Tableau, and Power BI.


Airport Flight Delay Analysis dashboard preview
SQLPythonTableau
Airport Flight Delay Analysis
End-to-end Airport Flight Delay Analysis using Python, SQL Server, and Tableau with interactive dashboards to analyze airline performance, airport operations, delay trends, routes, and delay causes.
Real Estate Market Analysis dashboard preview
SQLTableauPythonExcel
Real Estate Market Analysis
Real Estate Market Analysis dashboard built with Python, SQL, Tableau, and Excel — covering revenue, property, geographic, and agent performance analysis, market growth tracking, property status & sales trends, plus interactive filters and KPI cards.
Uber Analysis dashboard preview
TableauSQLExcel
Uber Analysis
An interactive Uber Analytics Dashboard built using Tableau, SQL, and Excel to analyze ride demand, customer behavior, driver performance, location insights, payment trends, and business KPIs through dynamic visualizations.
Retail Sales Analytics dashboard preview
TableauSQL
Retail Sales Analytics
An end-to-end Retail Sales Analytics project using SQL and Tableau featuring interactive dashboards for Sales, Product, Customer, and Region analysis with actionable business insights.
Expense Tracker Analysis dashboard preview
TableauSQLPythonExcel
Expense Tracker Analysis
An end-to-end Expense Tracker Analytics Dashboard built with Python, SQL Server, and Tableau to analyze personal financial transactions, spending habits, income, budgets, and savings.
E-Commerce Sales Dashboard dashboard preview
Power BIExcelDAX
E-Commerce Sales Dashboard
Interactive Power BI dashboard analyzing sales, profit, customers, products, orders, regional performance, and returns across 3,000+ transactions with 25+ DAX measures.
Hotel Booking Analysis dashboard preview
TableauSQLExcel
Hotel Booking Analysis
Hotel Booking Analytics dashboard built with Tableau, SQL, and Excel Pivot Tables to analyze bookings, cancellation rates, guest demographics, revenue per room, and hotel performance.
Social Media Analysis dashboard preview
ExcelPivot Table
Social Media Analysis
Social Media Analysis dashboard built with Excel Pivot Tables to analyze platform performance, engagement, campaign ROI, audience insights, revenue, and advertising spend across 5,200+ posts.
Restaurant Order Analysis dashboard preview
SQLTableau
Restaurant Order Analysis
Restaurant Order Analysis dashboard using Tableau and SQL to analyze sales, customer behavior, peak ordering hours, menu categories, and operational throughput.
Logistic Shipment Analysis dashboard preview
ExcelPivot TablePython
Logistic Shipment Analysis
Supply chain and logistics performance dashboard utilizing Excel Pivot Tables and analytics to evaluate on-time delivery rates, transit delay causes, carrier efficiency, and route optimization.
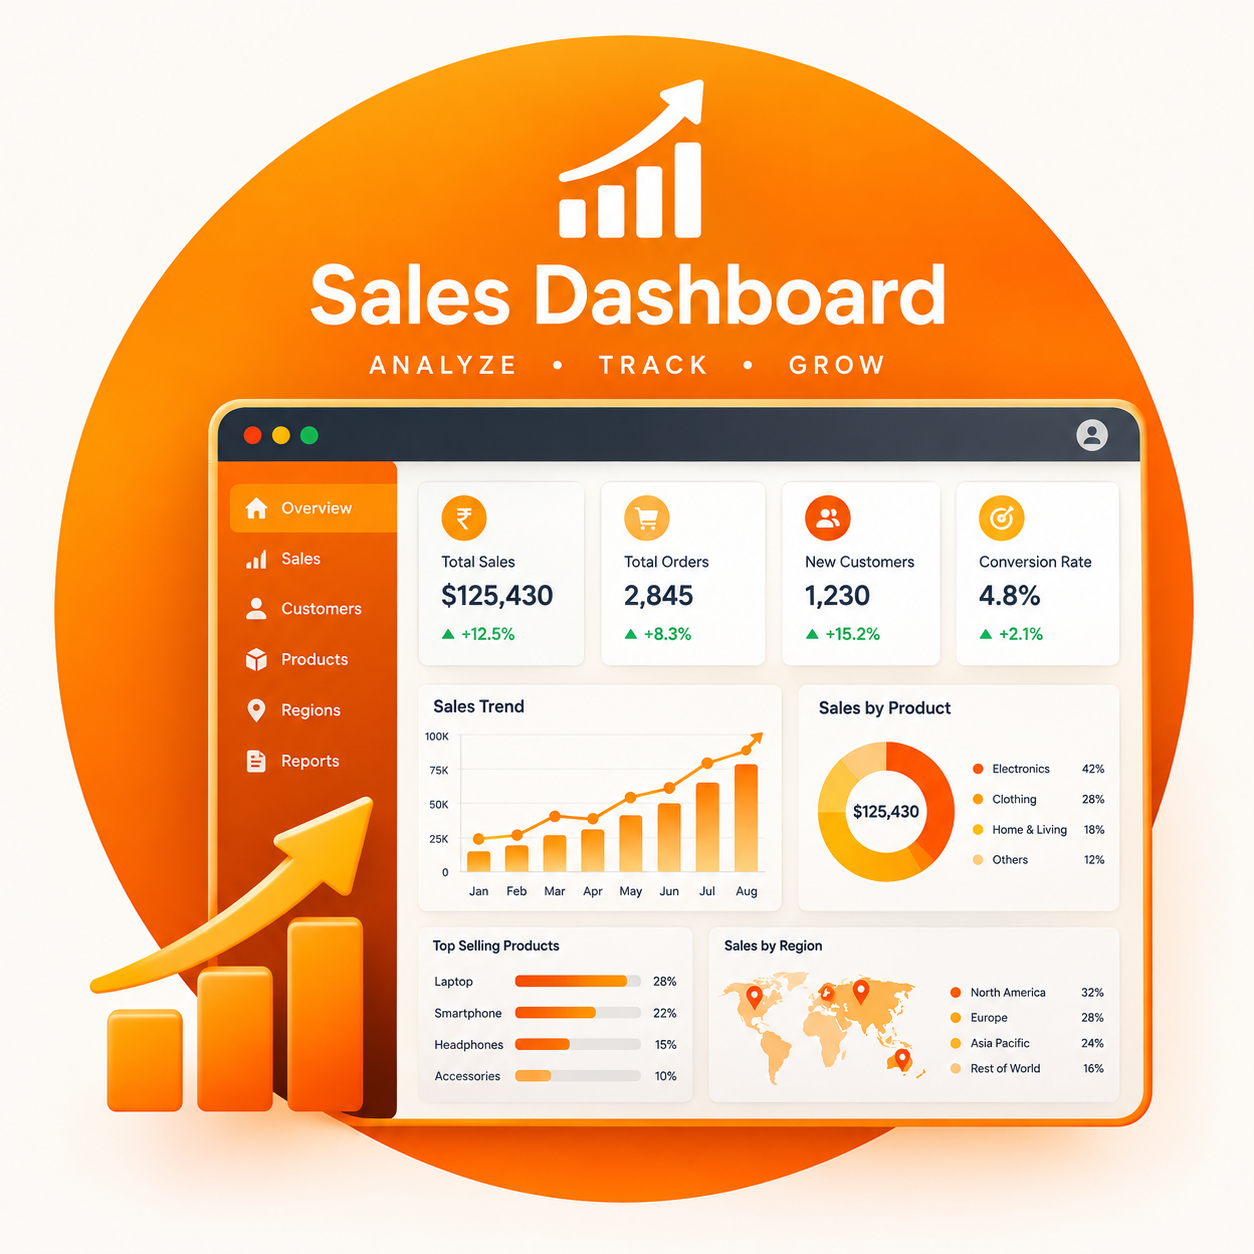
Sales Dashboard dashboard preview
PythonSQLTableauExcel
Sales Dashboard
Interactive Sales Dashboard Analytics project using Tableau, Excel, SQL, and Python to analyze multi-region sales, profitability, product segments, and year-over-year target achievements.
Healthcare Operation Intelligence Platform dashboard preview
Power BIDAX
Healthcare Operation Intelligence Platform
Power BI operational intelligence platform tracking hospital KPIs, emergency room wait times, bed occupancy rates, patient throughput, and department staffing efficiency with advanced DAX measures.
Startup Funding Intelligence Platform dashboard preview
Power BIDAX
Startup Funding Intelligence Platform
Startup Funding Intelligence Platform analyzing startup funding trends, investor activity, industries, round sizes, and global investment patterns using Power BI and DAX.
Personal Finance Dashboard dashboard preview
SQLTableau
Personal Finance Dashboard
Comprehensive personal finance dashboard engineered in SQL and Tableau to visualize income streams, expense breakdowns, monthly savings targets, net worth trajectory, and cash flow patterns.
Github Technology Trend Analyzer dashboard preview
Power BIDAX
Github Technology Trend Analyzer
Open source analytics platform built in Power BI with DAX modeling developer velocity, programming language market shares, repository star trajectories, and technology adoption cycles.
Job Market Intelligence Dashboard dashboard preview
Power BIDAX
Job Market Intelligence Dashboard
Job Market Intelligence Dashboard built with Power BI to analyze hiring trends, market salary benchmarks, in-demand technical skills, top hiring companies, industries, and job locations.
Banking Loan Risk Analysis dashboard preview
Power BIDAXSQLExcel
Banking Loan Risk Analysis
Banking Loan Risk Analysis Dashboard using Power BI, Power Query & DAX to analyze loan portfolio performance, default probabilities, credit risk tiers, and customer demographic metrics.
Telecom Churn Analysis dashboard preview
Tableau
Telecom Churn Analysis
Telecom Customer Churn Analysis using Tableau to evaluate customer attrition drivers, contract lengths, service usage patterns, demographic risk profiles, and revenue impact.
Pulse Board Analytics dashboard preview
Tableau
Pulse Board Analytics
Interactive Tableau analytics board delivering organizational pulse metrics, real-time KPI scorecards, sentiment and engagement trends, and cross-team operational performance indicators.
Movie OTT dashboard preview
Power BIDAX
Movie OTT
Movie / OTT Platform Data Analysis dashboard using Power BI and DAX to dissect streaming content catalogs, IMDb/Rotten Tomatoes ratings, genre popularity, platform exclusives, and trends.
Movie Analysis dashboard preview
SQLTableau
Movie Analysis
Movie industry analytics project built with SQL queries and Tableau visualizations analyzing box office revenue, production budgets, ROI ratios, genre profitability, and top-rated movies.
Myntra Analysis dashboard preview
PythonSQLExcelPower BIDAX
Myntra Analysis
Myntra E-Commerce Data Analytics project using Excel, Python, Microsoft SQL Server, and Power BI to analyze sales, product catalogs, brand market shares, discounts, customer ratings, and returns.
Nykaa Analysis dashboard preview
PythonSQLTableauExcel
Nykaa Analysis
Beauty & cosmetics retail analytics analyzing Nykaa e-commerce data with Python, SQL, Tableau, and Excel — examining category revenues, brand margins, discount effectiveness, and repeat customer trends.
Smart City Traffic Analysis dashboard preview
Power BIDAX
Smart City Traffic Analysis
Smart City Traffic Analytics dashboard built using Power BI and DAX to analyze urban traffic trends, congestion bottlenecks, vehicle patterns, accident-prone zones, and weather impact.
Airline Ticket Price Optimization dashboard preview
ExcelPivot Table
Airline Ticket Price Optimization
Advanced Excel analytical model employing Pivot Tables, scenario analysis, and pricing elasticity to optimize airline flight pricing, seat occupancy load factors, and route revenue yield.
College Placement Analytics dashboard preview
ExcelPivot Table
College Placement Analytics
Excel dashboard for college placement analytics: analyzing 3,500+ student placement records with Pivot Tables, tracking recruiter participation, salary packages, department trends, and hiring KPIs.

My Analytics Workflow

An animated view of how I take raw data to a decision-ready dashboard.

Raw Data to Decision-Ready Dashboard
🗃️
Data Sources
🗄️
SQL Queries
🐍
Python Cleaning
📋
Excel Modeling
📈
Tableau
📊
Power BI Dashboard

My Growth Timeline

July 2025 — May 2026
Itkraftz
Software Product Owner Intern
Supported product planning, requirements gathering, and collaboration across software development teams
2024 — 2025
Brindavan College
Master of Computer Applications (MCA)
Completed MCA with a CGPA of 8.71
2020 — 2023
Jyoti Nivas College Autonomous
BSc Computer Science
Completed undergraduate studies with 66%

Impact in Numbers

🗂️
0
Projects Completed
📦
0
Datasets Analyzed
📊
0
Dashboards Built
📈
0
KPI Reports Delivered
🗄️
0
SQL Queries Automated

Open Source Portfolio

Vijayalakshmi R
@vijeelakshmi
—
Repos
—
Stars
—
Followers
—
Forks
View GitHub Profile
Loading your latest repositories…

Professional Credentials

Industry-recognized certifications validating data analytics expertise.

🎓
Simplilearn
Introduction to Data Analytics
Issued: 20 May 2026 · Simplilearn
Certificate Code: 10243365
Data Analytics
📊
Simplilearn
Introduction to MS Excel
Issued: 20 April 2026 · Simplilearn
Certificate Code: 10122992
Microsoft Excel
📈
Simplilearn
Power BI for Beginners
Issued: 23 December 2025 · Simplilearn
Certificate Code: 9622919
Power BI
📉
Simplilearn
Tableau Data Visualization Basics Tutorial
Issued: 14 February 2026 · Simplilearn
Certificate Code: 9836832
TableauData Visualization
🗄️
Simplilearn
Introduction to SQL
Issued: 12 June 2026 · Simplilearn
Certificate Code: 10339482
SQL
🏅
Cisco Networking Academy
Data Analytics Essentials
Issued: 23 January 2026 · Cisco Networking Academy
Data Analytics
🐍
Google · Coursera
Crash Course on Python
Issued: 11 August 2026 · Google · Coursera
PythonProgramming

Let's Connect

Open to data roles, freelance analytics projects, and exciting collaborations.

Email
vijaya0835@email.com
Phone
+91 8861916135
Location
Bangalore, India
LinkedIn
linkedin.com/in/vijayalakshmi0808
GitHub
github.com/vijeelakshmi
Message sent! I'll get back to you soon.